Home 2023 › Forums › Vultology & Learning Center › Vultology Quiz #5
I'd love to but can you send me the vid please ?
@staas Yikes! Sorry - major brain fail. Video sent.
Okay! Time for results!
Here’s “Jane:”
https://www.youtube.com/watch?v=Z3ZgSBwT4ZE&
And here is her youtube channel:
https://www.youtube.com/channel/UCprRsjNTNMRDeO4GmrIRk4Q
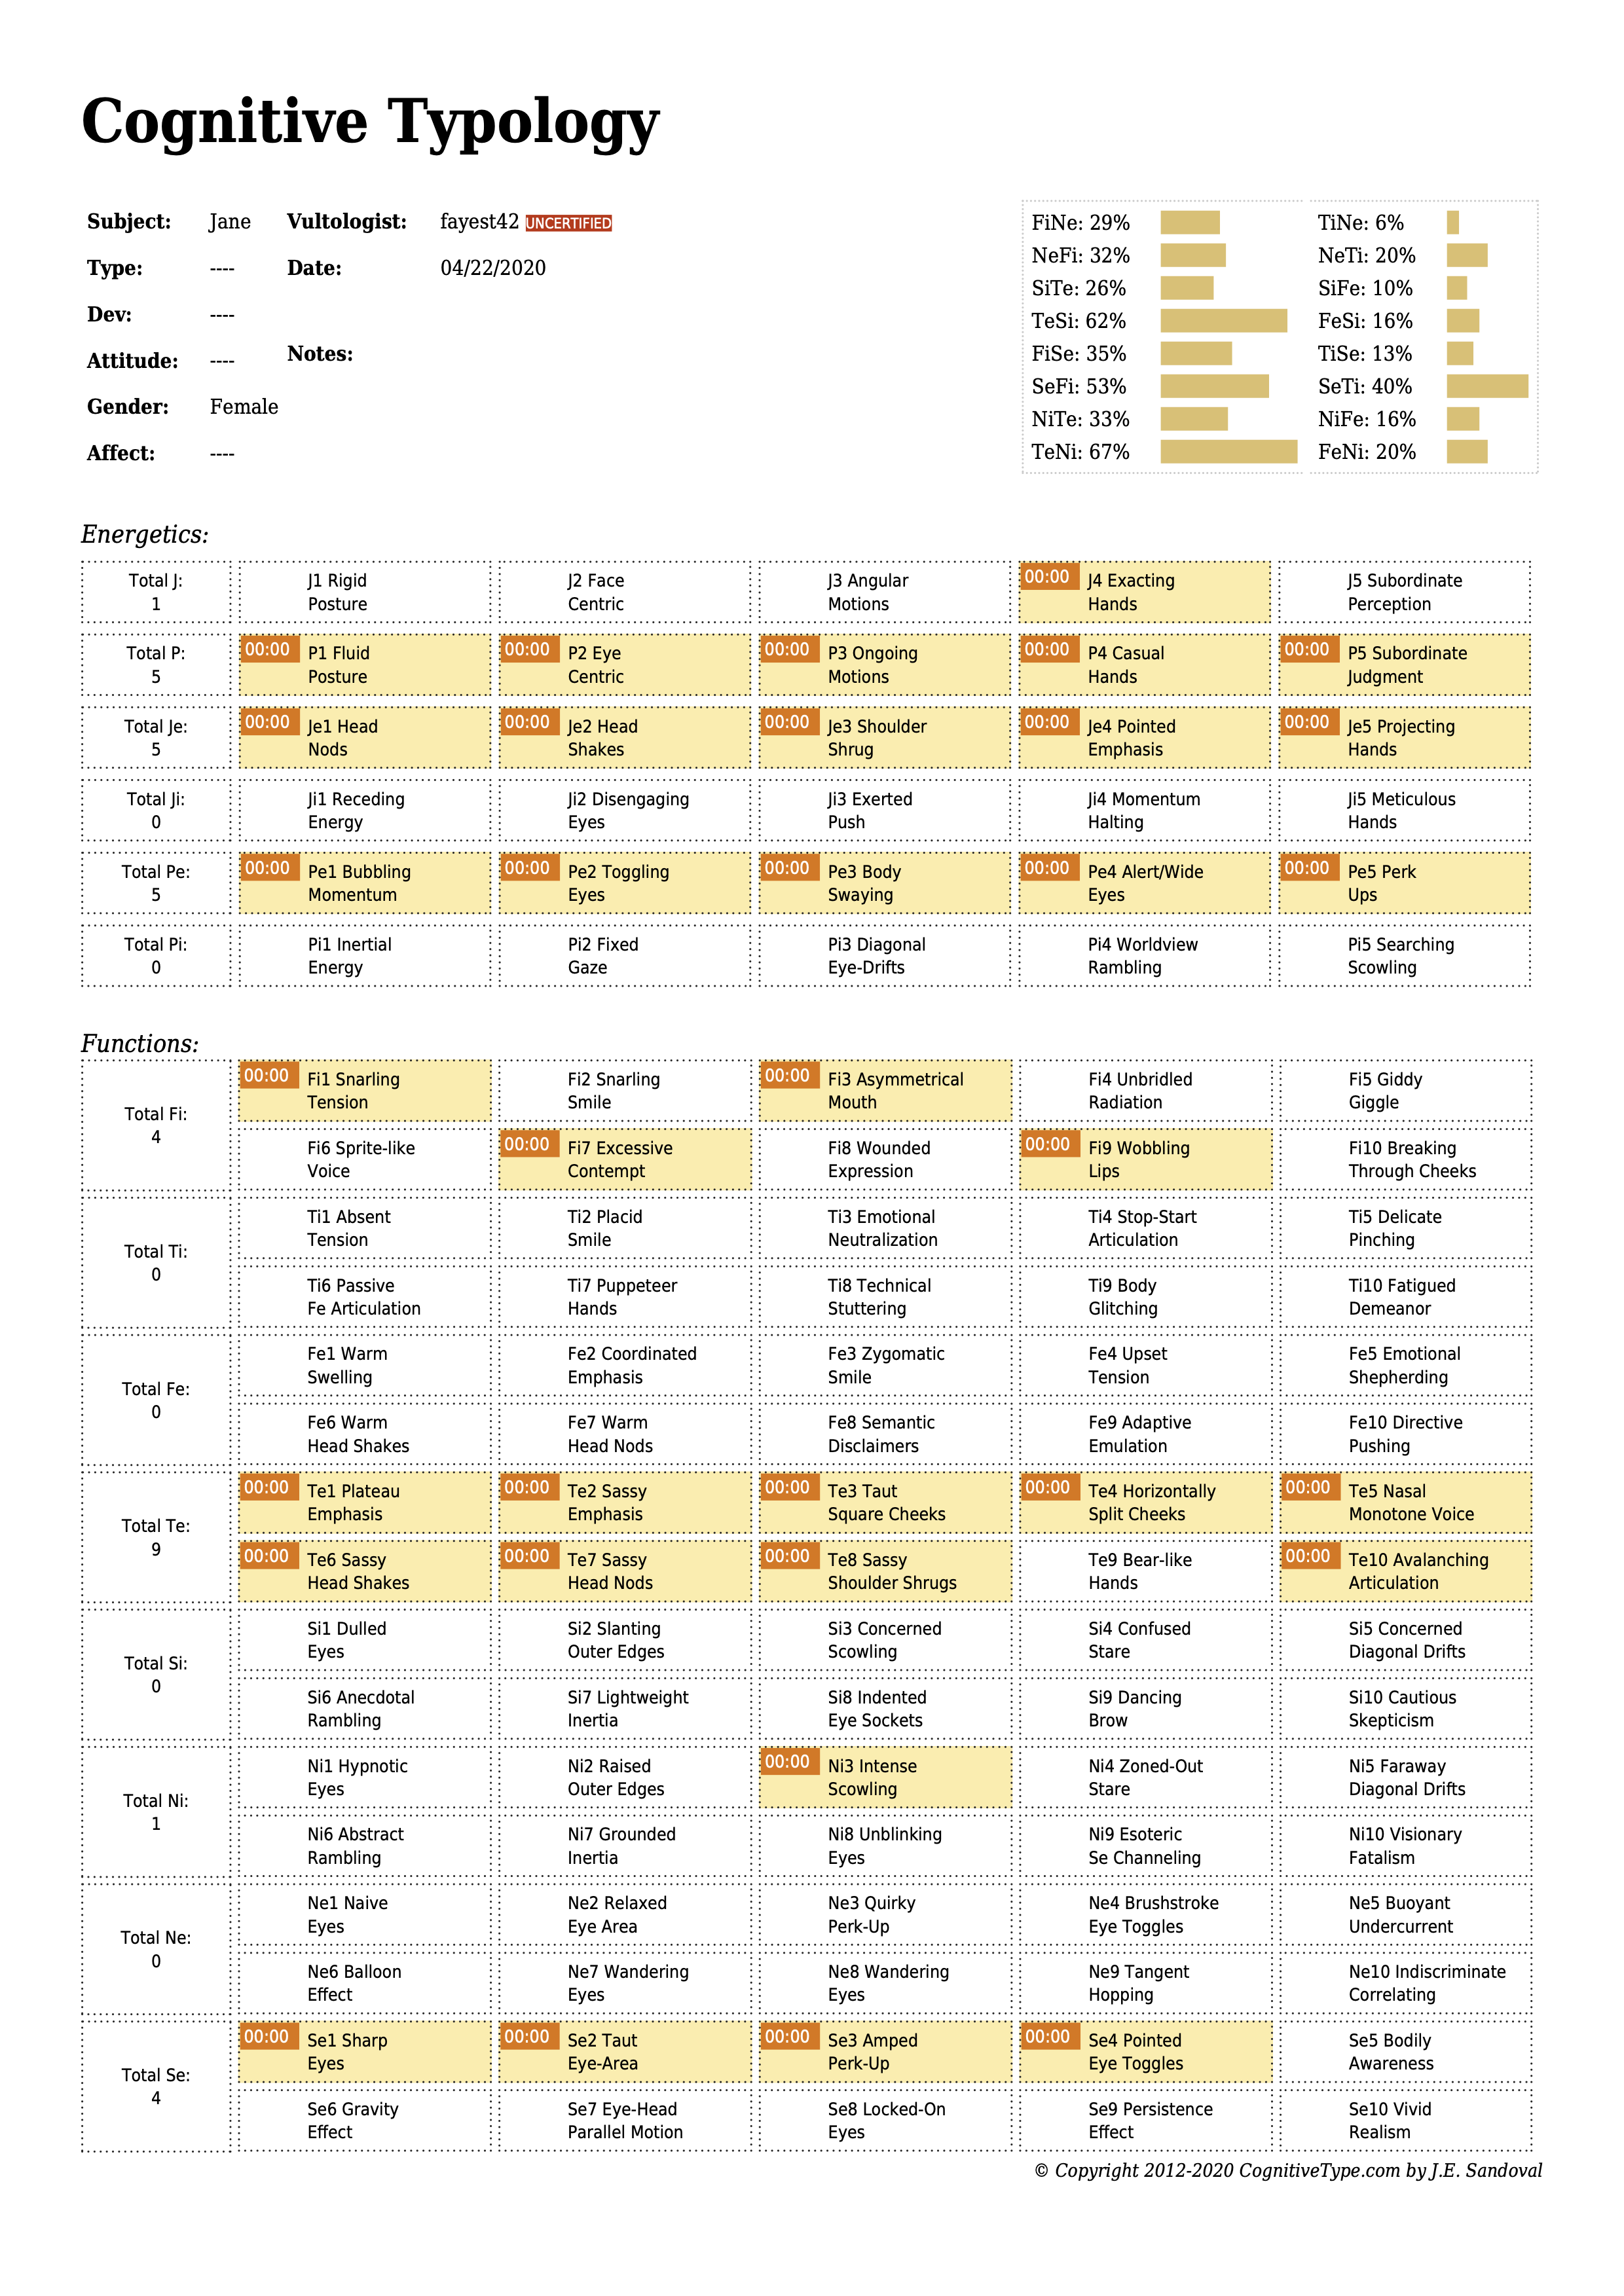
I got 14 submissions, including my own. To generate the "consensus" result, I went into the codifier and checked off every signal that 7 or more of the participants had checked off. I wasn't sure what type to consider the consensus type because, as you can see below, the algorithm considers TeNi to be most likely, but all 5 of the P signals are checked while only 1 of the J signals is checked. The algorithm says the most likely P-lead type is SeFi, which was also the most common type chosen by participants (8/14 participants chose SeFi).
Here is the consensus report:

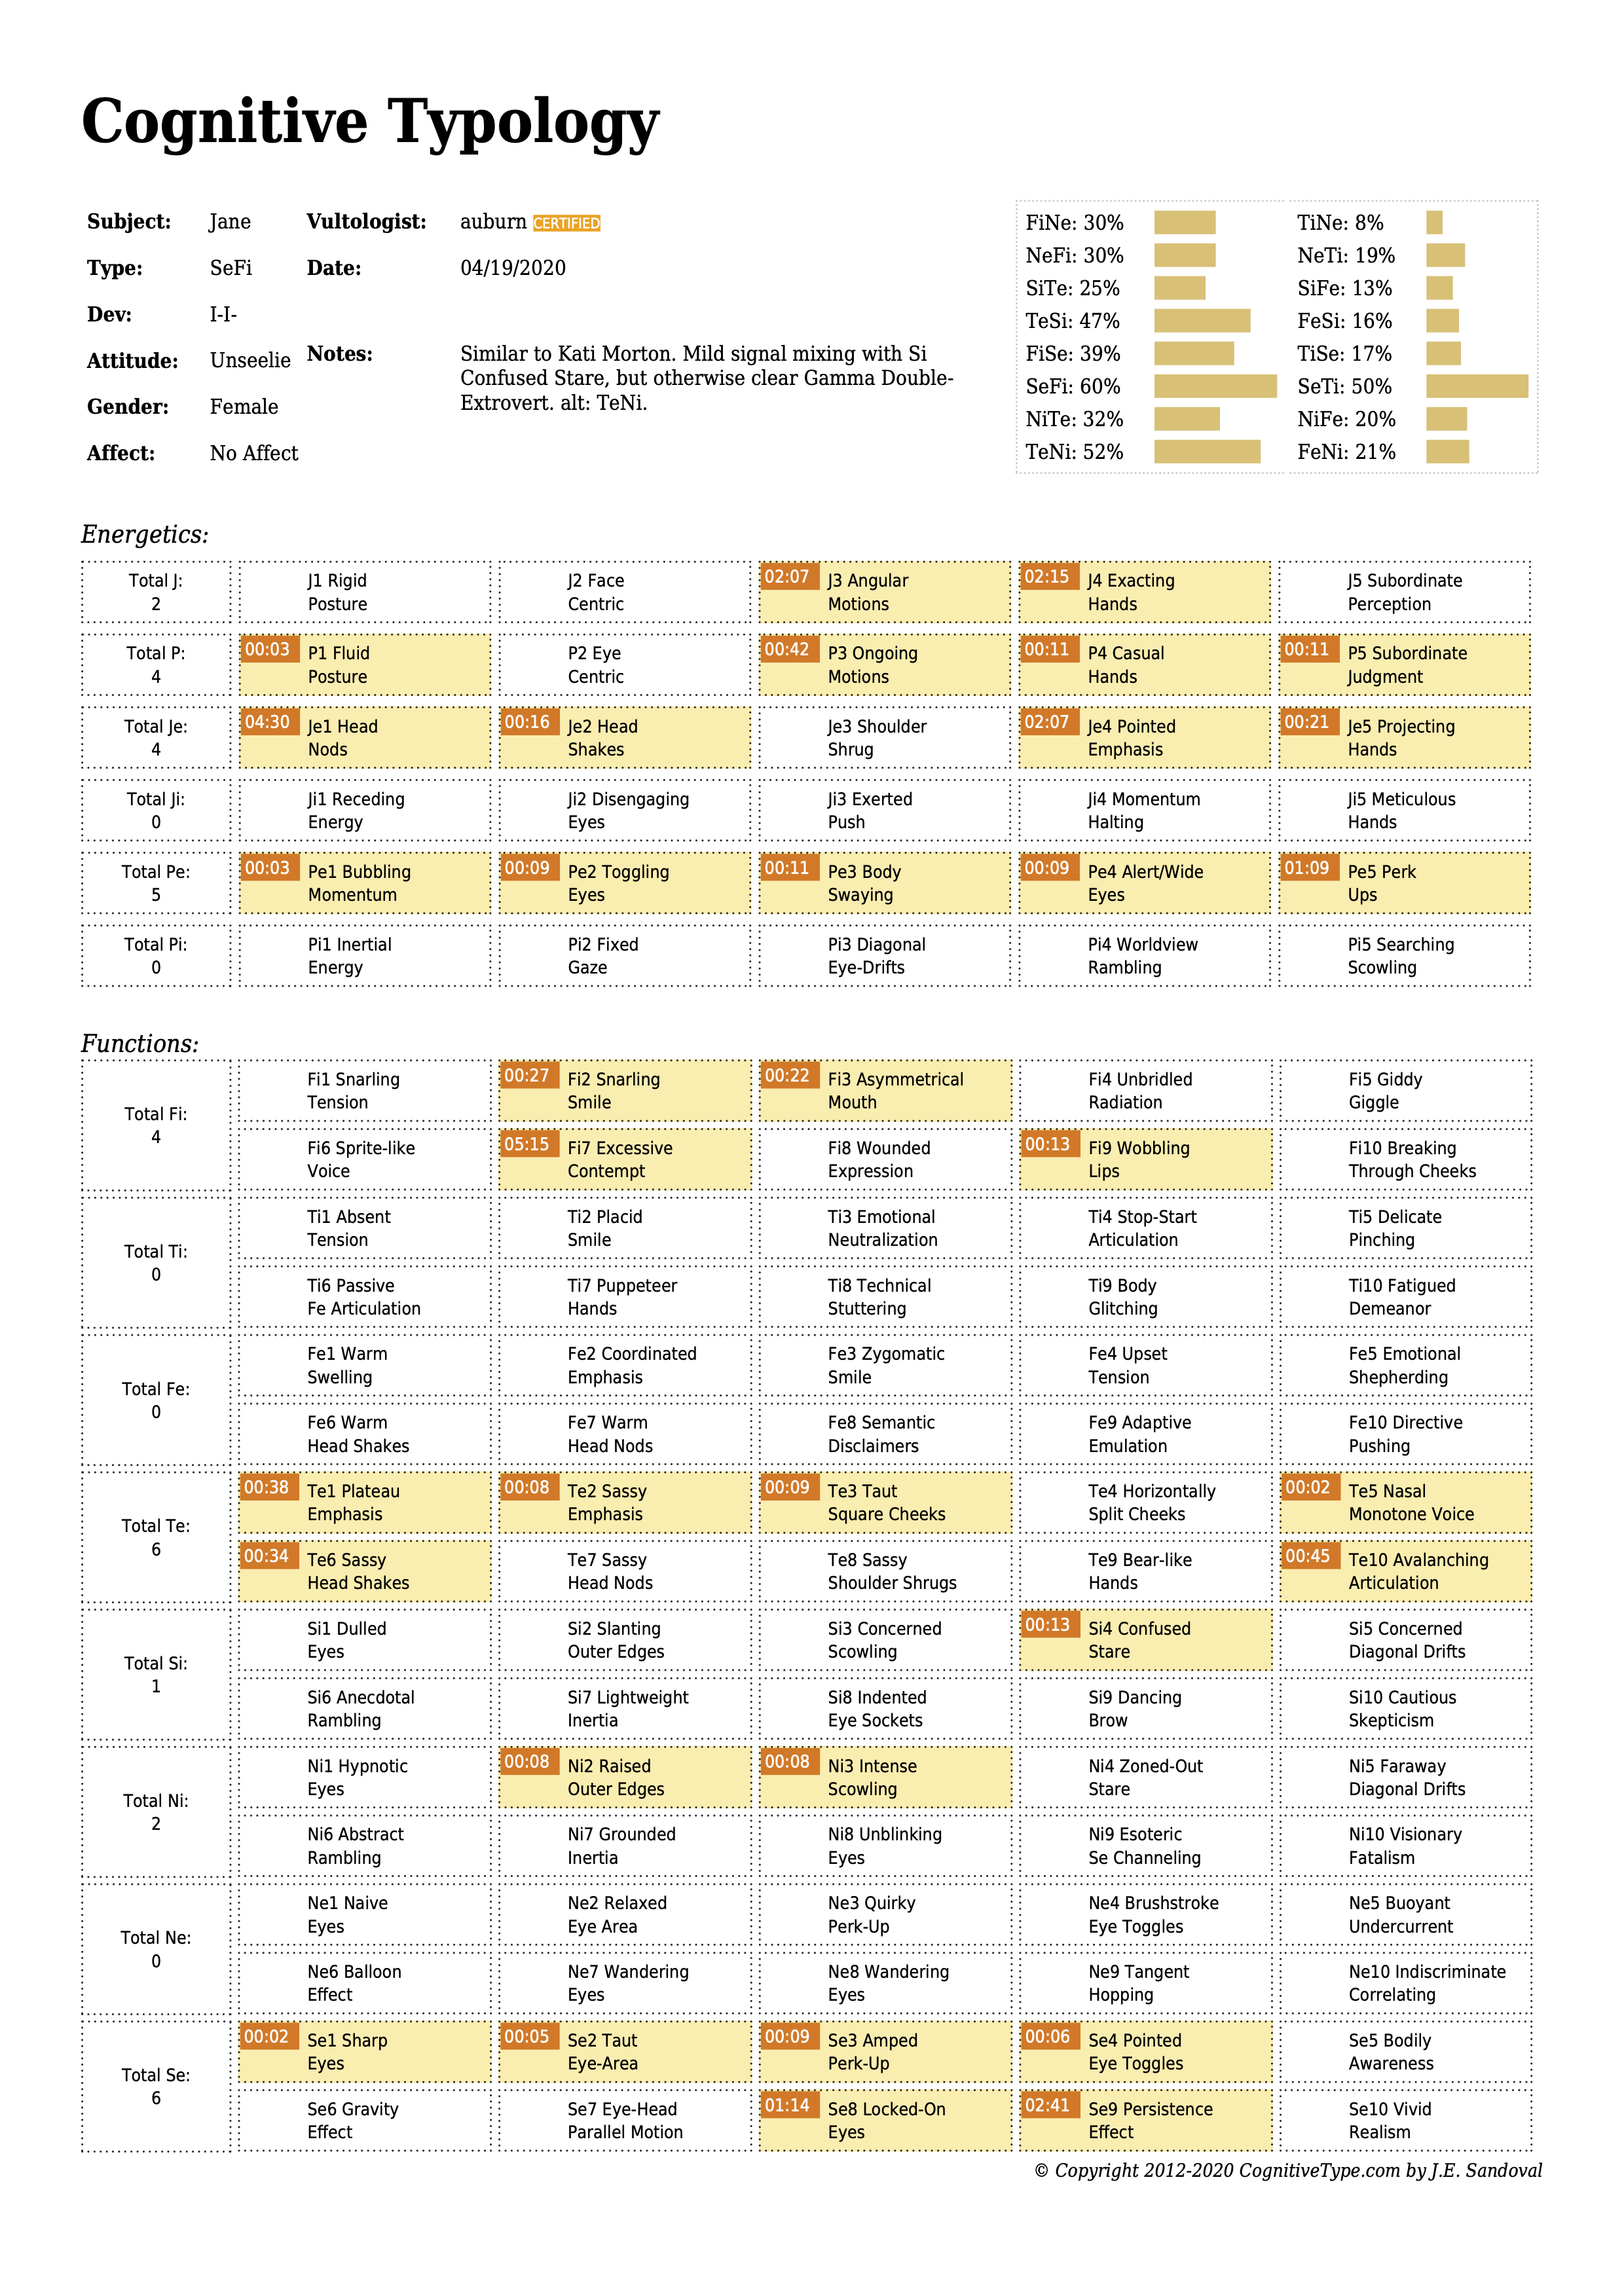
And for comparison, here is Auburn's report:

I have more I want to say, but at the moment, my family is waiting for me to come to dinner, so I'm going to run off and come back later for more. Go ahead and start sharing your thoughts, if you wish.
Oh dear, the images are giant. You can right click on them to open them in a new tab to see the whole thing. I'll see if I can fix that later.
Edit: Fixed it.
Excellent!
So I just wanted to say one thing -- about the "percentages" -- I don't think the algorithm I've got right now is properly weighted when it comes to teasing apart complex development levels. For example, in the consensus report above it says
A vultologist would be able to identify that this signal combination means Se+Te conscious Gamma, but the number of Te signals (i.e. 9) is not what is used for telling apart hierarchical position. Instead, we look at energetics to tell apart hierarchy, and while the energetics are tied at Je vs Pe ,the tie-breaker comes overwhelmingly in P-lead over J-lead.
The 8 function signals should be used more for the identification of quadra, more broadly, while hierarchy is determined by energetics. But right now the percentage weighting I have on the algorithm is not calibrated properly. It adds 5% for each function signal, which is far too much, while the energetics have far too little.
So overall it does appear to me that the consensus actually is SeFi l-l-, not TeNi (despite what the percent says). Very excited about this. Looking forward to the full notes! ![]()
@auburn Okay, that's what I was thinking too, but I wasn't sure how to take the percentages into account. Thanks for clearing that up.
If anyone wants to see the specific signals that each person saw, I have that data here:
https://docs.google.com/spreadsheets/d/1QBzHS8TTRB9m-9yxB5xuNcslTk6SmH3Kr8EJ1Y05W70/edit?usp=sharing
I chose to make the responses anonymous (except for Auburn) because I wasn't sure if everyone would be okay with their responses being public. That document also includes two scores for each participant, showing on what percentage of signals they agreed with the consensus or with Auburn.
I'm hoping that maybe @ladynerdsky might do some stats with these results like she did on the last quiz 🙂 If not though, I'd be willing to do that another day.
In regards to how our typings matches up with Kaela's actual psychology, here are some notable things I have gathered about her from a quick look at some of her other videos:
Personally, I found this quiz to be surprisingly challenging, although the results were fairly good. For future quizzes, @Auburn, I wonder if you could give us some tips on how to go about the typing process. Do you go through the whole video looking for a certain set of signals and then watch again looking for another set and so on? Or how do you do it?
I'd be curious to hear what everyone thought of the process and format of this quiz. Here are a few things that came to mind for me:
Thanks for all of this @fayest42. Erasing names is frustrating, though. I like to see my progress (or failure) + rank (whether its bad or good), and I think participating means we are OK with the whole process, including the publication of results.
Edit: Please, could you send me mine in PM?
Interesting topic.
Could someone fill me in--was I dreaming again, or did I hear some talk somewhat recently about adding timestamps to the signals observed, as I thought used to be done?
I kind of feel like, if I get to see several examples of videos with time-stamped signals, I might start getting the hang of it as to where I could participate next time there's a quiz.
Thanks for all of this @fayest42. Erasing names is frustrating, though. I like to see my progress (or failure) + rank (whether its bad or good), and I think participating means we are OK with the whole process, including the publication of results.
Edit: Please, could you send me mine in PM?
Same here 🙂
Edit:
POST SCRIPTUM
I cared to click on the signals on the exact moment I noticed them only some of the times... that is, when I thought it was crucial (for example, to discriminate between Ne and Se). I didn't think other people could use the timestamps. ^^"
@a.k.a.Janie
When we are checking the signals, automatically the time when the signal shows is added to the report. This will make the following discussions awesome because we can check where we saw the signals !! I will be back a little later with some questions.
You can see the times when the signals show in Auburn's report ! But you need to watch the video in parallel with reading the report.
I don't know how to add the timestamps directly in the video. It could be perfect if we could do this too.
Regarding results - I agree with Chalier. I don't mind if they are posted.
@fayest42 - my suggestions are :
- make sure there is a smile, yes (but I did see a snarling smile in this one ! I'll come back later with the exact time...);
- try to avoid videos that are easy to find on YouTube by little cheaters ! 🙂 This girl was talking about a specific place and had 8 tips about visiting it. She has bullet points for every tip that you can simply search on YouTube. The video used for Auburn's last quiz was more ambiguous, you had to look for a foreigner student in the UK who visited her grandparents...it would have been challenging to find her channel... Challenging enough to rather just focus on typing based on the available video than on doing "research". 🙂
I know we are supposed to not try to find the YouTube channels of the quiz samples but maybe some are tempted to. I sure was since I am pointing this out. 🙂
- I'd suggest to avoid this type of presentations because they might make people use their Je more than they would usually do. A dialogue might be better. A somewhat organized ramble about a certain topic could be great too, but if it has bullet points and images perfectly correlated to what is being said, it means there was a lot of preparation involved.
- The length was perfect ! You get to see her repeat some signals many times and can get a better understanding of her psychology too. I wouldn't prefer shorter ones.
- The framing was pretty good. It would have been better if we could have seen a bit more of her body. It was indeed a little harder to catch the ending of her hand movements. I could see the Te plateau velocity but couldn't quite prove Se gravity. I mean...I tried to but I don't think it's conclusive. 🙂 I am sure her hands just fell down after the choppy gestures but I can't really show it, you know?
Here's the edited video we used, for correct timestamps: https://www.youtube.com/watch?v=imidL5dvW5Q
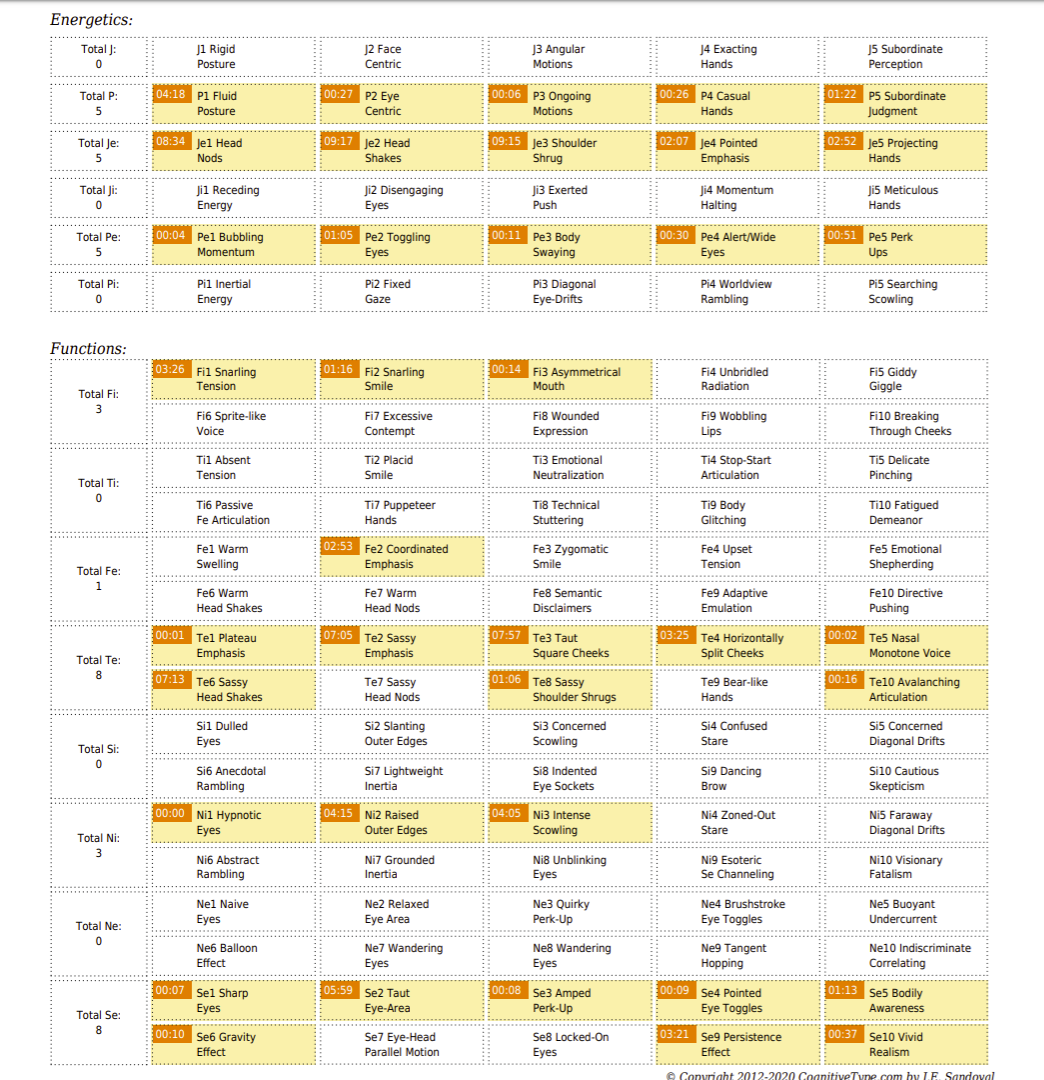
I'm glad my practice showed up! (I must be that "Participant 2" without dev level) Here are my timestamps:

@auburn, since the fixed gaze of Pi-2 excludes eye contact, shouldn't Se-8's locked on eyes also exclude staring into the camera?
And you described the pointing at 2:15 as as J-4 exacting hands, yet isn't that actually a pointed emphasis? As the examples and description of J-4 exacting hands suggest repeated forward vectors, which isn't happening around 2:15
And finally, the name of Fi-7 Excessive Contempt implies contextual dependence while it's description ignores this nuance; so is all contempt excessive?
@fayest42, I think video resolution matters more than the length, framing, and social setting. Clear smiles make it easier, and there was a quick smile at 1:15, yet that's just one of so many factors that it seems better to not start handpicking videos.
I figured people could tell who they were in the data by just looking at their own codifier pdfs. But to simplify things, I'll just message everyone with their scores.
@janie - the timestamps feature is currently on. 🙂 you can see them in my report, but i think for the consensus report fayest couldn't pick any specific timestamp so they're all set to 0:00.
Also, while the consensus was SeFi l-l-, and no Ne/Si signals made it past the 7/14 threshold, a few got up to 5 so for the sake of improving the methodology, I wanted to spend some time talking about.. her eyebrows. 😀
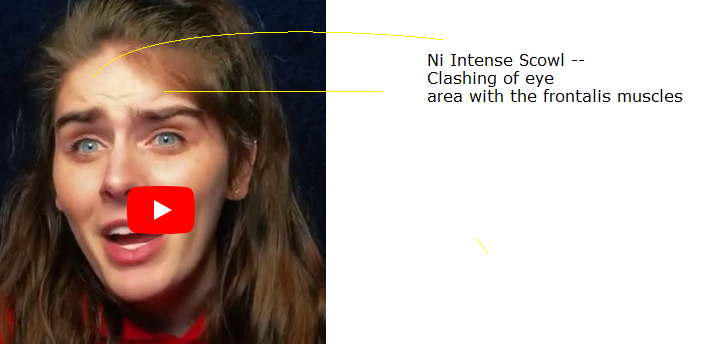
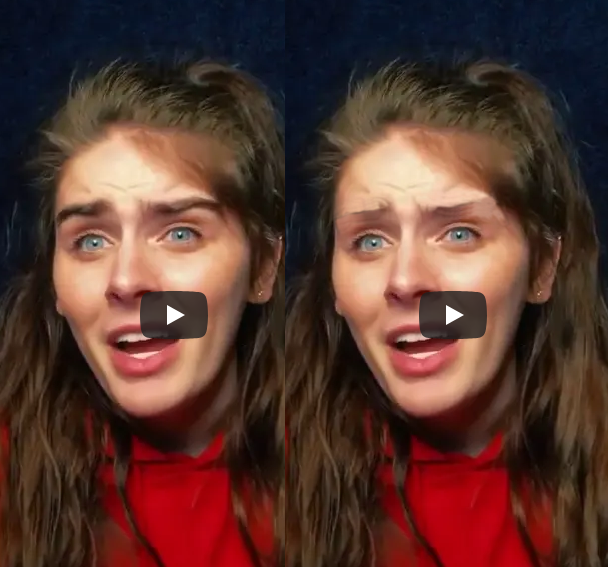
Speaking of timestamps, Mahsun recently brought up a point to me about how at 0:08 (what I put down for Ni Intense Scowl) that it looks more like an Si vultology. I really didn't pick the best timestamp, and so I wanted to try to correct that. We can see the Ni Intense Scowl in many other places in the video, and even for example in the vid thumbnail:

^ What we see is here is a "complexity" of clashing muscles, as the obicularis oculi collides with the frontalis muscle, creating these 'dents' above the brow. It's always important to remember that with the P functions, what we wanna look for is the differences in ocular tension.
Still, I think her brow really is something unusual-- like, an anatomical feature that interferes with the analysis because they're not only large but also hairy (heh! fayest that makes sense that she refuses to do anything with them ;p). Anyway, eyebrow hairs can be misleading because the hairs can go in a certain direction that the actual muscles under the skin do not. This happens with people like TeSi Richard Dawkins who has pointy brow hairs but a clearly lowered Si brow. One of the exercises that I do in my head often times is to try to imagine samples with shaved eyebrows. And I briefly went in and tried to photoshop her that way, to kinda illustrate:

^ The image to the right is her with shaved brows. I tried to be agnostic about the 'shape' below them, and not bias it. But they do look Se/Ni to me here overall, due to what's important which is the ocular tension clashing + the lack of heavy "weight" of the brow on the outer corners of the eyes.
Si brows don't stay elevated above the eyes, but instead tend to fall down on them and squish them. So the brow angle is less important than whether or not the preseptal area is propping them up or not, and allowing/disallowing them to rest over the eyes. In her case, the preseptal area remains taut, disallowing the brow from properly "falling" over the eye corners.
(y'know what, we should rename Si Slanting Edges to Si Lowered Brow Edges" -- to also have symmetry with Raised Outer Edges, as well as eliminate the "slant" terminology which misleadingly focuses on the angle-- as commented in this recent post.)
However, with all that said, at other times she does show the Si inverted curvature as currently described in the code. I don't think there's much way around that (although personally I still see this tension present at all times). And yea, I think I didn't check Si Dancing Brow, when I can see it now. So there's some legitimate signal mixing too. Dangit. I think the codifier is slowly being 'chiseled' into a better shape and its examples like this help me see what is/isn't part of the essential pattern.
(I haven't looked at her psychology yet-- but just wanted to comment a little on her rad eyebrows)
Hi to all,
First I'd like to raise an issue I have with such videos : the editing. This video was heavily edited and all sequences of blank, staredown, hesitation, slower pace were cut out which means a lot of signals are lost and a high pace content is artifficially created. I don't think it changes the result but it makes the video less authentic and I would favour unedited formats of videos.
Second, I will be working on the data you published and try to derive more consistent statistics. I don't think the grading of the test should not based on exact correspondence of signals, it's ok to miss some signals and not catch everything going on in the video. The most important is the final type imo, and that each function is correctly observed, and the specific signals are still important especially for a report, but not as important to be exactly the same, and can be best worked out by later discussion between the vultology team if a detailed accurate report is to be published. I'll try to think about a grading system that works, and that is also useful for @auburn I think who has some issues with his profiler like he said earlier and as I could observe, where observations are not weighted correctly to derive likely types, especially when doing averages and all.
@staas and @bera, I think the suggestions to look for a video that is less structured/edited are probably wise, to avoid people looking more Je than they are.
@staas, re: the grading, I think it’s quite useful to see both the level of agreement on the final type and the specific signals people saw. It helps Auburn see which signals people understand accurately and which signals might need more clarity added to them. And it helps us to learn the signals better. Perhaps I should have made a bigger deal out of the level of agreement on the overall typing though. Here are the stats on that:
ETA:
@auburn, I also have a few questions for you about some of the signals you saw.
Hi everybody !
So I have run a few statistical tests on the global results to better determine how well each one of us did on the test.
Here I will present you with two tables, and I want to explain them to you :
Here are the results with @auburn as the reference :
| TN | FP | FN | TP | Accuracy | Precision | Sensitivity (TP rate) | Specificity (TN rate) | f1 | Matthews | |
|---|---|---|---|---|---|---|---|---|---|---|
| Unnamed: 0 | ||||||||||
| Auburn | 69.09 | 0.00 | 0.00 | 30.91 | 100.00 | 100.00 | 100.00 | 100.00 | 100.00 | 100.00 |
| Participant1 | 60.00 | 9.09 | 3.64 | 27.27 | 87.27 | 75.00 | 88.24 | 86.84 | 81.08 | 72.12 |
| Participant2 | 60.00 | 9.09 | 5.45 | 25.45 | 85.45 | 73.68 | 82.35 | 86.84 | 77.78 | 67.25 |
| Participant3 | 58.18 | 10.91 | 4.55 | 26.36 | 84.55 | 70.73 | 85.29 | 84.21 | 77.33 | 66.43 |
| Participant4 | 61.82 | 7.27 | 7.27 | 23.64 | 85.45 | 76.47 | 76.47 | 89.47 | 76.47 | 65.94 |
| Participant5 | 62.73 | 6.36 | 9.09 | 21.82 | 84.55 | 77.42 | 70.59 | 90.79 | 73.85 | 63.05 |
| Participant6 | 59.09 | 10.00 | 5.45 | 25.45 | 84.55 | 71.79 | 82.35 | 85.53 | 76.71 | 65.57 |
| Participant7 | 62.73 | 6.36 | 10.91 | 20.00 | 82.73 | 75.86 | 64.71 | 90.79 | 69.84 | 58.21 |
| Participant8 | 66.36 | 2.73 | 18.18 | 12.73 | 79.09 | 82.35 | 41.18 | 96.05 | 54.90 | 47.60 |
| Participant9 | 62.73 | 6.36 | 19.09 | 11.82 | 74.55 | 65.00 | 38.24 | 90.79 | 48.15 | 34.78 |
| Participant10 | 51.82 | 17.27 | 10.91 | 20.00 | 71.82 | 53.66 | 64.71 | 75.00 | 58.67 | 37.95 |
| Participant11 | 54.55 | 14.55 | 17.27 | 13.64 | 68.18 | 48.39 | 44.12 | 78.95 | 46.15 | 23.69 |
| Participant12 | 58.18 | 10.91 | 18.18 | 12.73 | 70.91 | 53.85 | 41.18 | 84.21 | 46.67 | 27.61 |
| Participant13 | 50.91 | 18.18 | 20.00 | 10.91 | 61.82 | 37.50 | 35.29 | 73.68 | 36.36 | 9.14 |
We can see that Participant 1 clearly stands out, with Participant 2 3, 4 and 6 a close second, narrowly tailed by Participant 5 himself tailed by Participant 7. All others fall behind and the 61% accuracy of Participant 13 seems to be more down to luck (the advantage of such metric is to clearly recognize when results are due to lucky guesses or not)
Now onto the consensus scores :
| TN | FP | FN | TP | Accuracy | Precision | Sensitivity (TP rate) | Specificity (TN rate) | f1 | Matthews | |
|---|---|---|---|---|---|---|---|---|---|---|
| Unnamed: 0 | ||||||||||
| Auburn | 63.64 | 4.55 | 5.45 | 26.36 | 90.00 | 85.29 | 82.86 | 93.33 | 84.06 | 76.79 |
| Participant1 | 60.91 | 7.27 | 2.73 | 29.09 | 90.00 | 80.00 | 91.43 | 89.33 | 85.33 | 78.20 |
| Participant2 | 60.91 | 7.27 | 4.55 | 27.27 | 88.18 | 78.95 | 85.71 | 89.33 | 82.19 | 73.51 |
| Participant3 | 59.09 | 9.09 | 3.64 | 28.18 | 87.27 | 75.61 | 88.57 | 86.67 | 81.58 | 72.47 |
| Participant4 | 61.82 | 6.36 | 7.27 | 24.55 | 86.36 | 79.41 | 77.14 | 90.67 | 78.26 | 68.35 |
| Participant5 | 63.64 | 4.55 | 8.18 | 23.64 | 87.27 | 83.87 | 74.29 | 93.33 | 78.79 | 70.01 |
| Participant6 | 59.09 | 9.09 | 5.45 | 26.36 | 85.45 | 74.36 | 82.86 | 86.67 | 78.38 | 67.69 |
| Participant7 | 62.73 | 5.45 | 10.91 | 20.91 | 83.64 | 79.31 | 65.71 | 92.00 | 71.88 | 61.01 |
| Participant8 | 67.27 | 0.91 | 17.27 | 14.55 | 81.82 | 94.12 | 45.71 | 98.67 | 61.54 | 57.19 |
| Participant9 | 65.45 | 2.73 | 16.36 | 15.45 | 80.91 | 85.00 | 48.57 | 96.00 | 61.82 | 53.83 |
| Participant10 | 54.55 | 13.64 | 8.18 | 23.64 | 78.18 | 63.41 | 74.29 | 80.00 | 68.42 | 52.29 |
| Participant11 | 58.18 | 10.00 | 13.64 | 18.18 | 76.36 | 64.52 | 57.14 | 85.33 | 60.61 | 43.98 |
| Participant12 | 59.09 | 9.09 | 17.27 | 14.55 | 73.64 | 61.54 | 45.71 | 86.67 | 52.46 | 35.50 |
| Participant13 | 52.73 | 15.45 | 18.18 | 13.64 | 66.36 | 46.88 | 42.86 | 77.33 | 44.78 | 20.71 |
From this point of view, Participant 1 is as good as Auburn and was best at predicting the consensus. We have then Participants 2 to 6 on a scale behind corresponding to good results and others tend to fall out.
Participant 1 seems to be really a good match to Auburn on this test. However, I will next be working on how best to define the consensus, which is basically the same problem @auburn pointed out for his profiler : which signals, (for example energetics are primordial), are the most critical to define type and how to take that into account. The majority testing has the inconvenient to level all signals in this regard, but there are statistical methods I can use to derive something better.
And indeed, scores up here do not attribute more importance to correctly detect some signals relatively to others, while it should as explained just above. So if a good grading and consensus method is derived, I'll be able to recalculate everything.
And if you have some results from other tests put up in a very similar format (or exactly same format, please that would be awesome) than what @fayest42 did on her Google Docs, you can send them to me I have a Python pipeline ready and I'll be able to give back scoring in no time.
Cheers to all !
Just to clarify, I am speaking of signals not functions
Some precisions on how exactly these measures can improve your typings :
I would imagine a good typologist to be balanced in both sensitivity and specificity, both above 80%. However, if we look at how type is derived, the signals that are positively there are scarce (around 30% of all signals) and some of them are really essential not to miss (a small change in energetics signals can change a whole typing altogether). So I would say a high specificity is a more desirable trait than a high sensitivity in this test, so people who are a not too much under 80% sensitivity with very high specificity (> 90%), the careful people, may still be good at typing, with a very positive trait given how this test is assessed. And the scores on the right are here to confirm this.
I know nothing about statistics and grading-type exercises in general, but what would happen if we attached greater weights to more vital information in a typing? For example: what if getting the type right or wrong is worth up to 4 points (one for each function and two for correct order), the development level is also up to 4 points, and each P/J energetics signal is worth 2 points? Would that make an end percentage more reflective of actual skill at typing?
I was participant 5, and while I got decent scores, I typed her as a wholly different type - albiet with the same functions conscious. Shouldn't my score be reflected as lower against the consensus than it is currently?
@alice there are several things to answer you :
Just to clarify, I am speaking of signals not functions
Ah! It's only after I read this that I started to get your post! Lol
I like this!
This is indeed very helpful information, and I'm gonna go through it more carefully later. I've gotta say I'm so excited to see these results! Especially how Participant 1 (it was Bera!) and I got such similar scores. Who's participant #2? (edit: ah Sander!) I want to know all the names! 😀
I was comparing these to the last quiz, specifically this post: https://cognitivetype.com/forums/topic/vultology-quiz-4-1-sample/page/4/#post-17168
And what I noticed is that I got exactly 90% of the group consensus then too. 😀 That's curious.
But in the previous quiz I think there was a slight bit more of a group consensus (with scores like Alice's up at 92.7%) and slight bit less consensus against my own report. This time the two reports seem closer to being same. And the top 6 participants have 85%-87% alignment to my own report, compared to the 80%-85% alignment of the previous quiz's top five. So that's a 5% jump in alignment between myself and the consensus, I think? (Not that my own report is the most important thing here-- but it just tells me that we have better alignment in reading methodology, which is what's exciting!)
Also yea lets talk a little about the percentage calculator. (Btw the percentage calculator has always been a sort of nice-to-have tool, to assist the reader, but not the determinant of type) The calc was weighted like this for this quiz:
1st function: (10/10 = 50%)
2nd function: (10/10 = 15%)
3rd function: (10/10 = 7%)
4th function: (10/10) = 3%
Energetic-Lead: (5/5) = 15%
Energetic-Aux: (5/5) = 5%
J/P Lead: (5/5) = 5%
^ So for example, checking 10 out of 10 signals in a given function would raise the percent bar to 50%. Same idea for the others. It all adds up to 100%. This equation is duplicated for each of the 16 types. So an example of this in the code would be:
TiSe % weighting breakdown:
Ti signals: (10/10) = 50%
Se signals: (10/10) = 15%
Ni signals: (10/10) = 7%
Fe signals: (10/10) = 3%
Ji signals: (5/5) = 15%
Pe signals: (5/5) = 5%
J signals: (5/5) = 5%
However, I've gone in and made adjustments to the weighting that I think is more true to how visual readings actually ought to be done:
NEW:
1st function: (10/10) = 30%
2nd function: (10/10) = 15%
3rd function: (10/10) = 7%
4th function: (10/10) = 3%
Energetic-Lead: (5/5) = 30%
Energetic-Aux: (5/5) = 5%
J/P Lead: (5/5) = 10%
^ The adjusted areas are bold. There was a strong imbalance towards the lead function's signals, with the gap between 1st function (50%) and 2nd function (15%) being an enormous 35%. Setting that down to 30% and 15% respectively, represents a better proportionality, imo, and that extra 20% is now allotted to the Energetic lead function (Je/Pi/Pe/Ji) and to J-vs-P signals.
This is now live in the codifier. And I re-ran the same signal tally sheet from the consensus and this time I got this:

In this particular case it's giving an equal output of 65% for SeFi and TeNi, which I think is still much better, although it's not edging SeFi over TeNi. However, given the specific signals chosen here, I like this estimate and don't feel too compelled to adjust the weighting any further. I think that it's at a good balance here-- what do you think, I wonder?
I do think the function signals should have some negotiation power over energetics, especially in extreme cases. And having 9/10 Te while only 4/10 Se signals is pushing it. So the percentage is reflecting that. However, adding just one additional signal (Se Locked on Eyes) (bringing it to Se 5/10) would break the tie and show SeFi weighted over TeNi. I think that's appropriate.
And for example in the excel sheet, Se-8: Locked-On eyes was at 6/14, so it barely missed the 7/14 threshold. One more participant clicking Se-8 would cause the new calculator to output SeFi, rather than a tie. Looking forward to your thoughts though. 🙂
Fayest, haven't forgotten your questions! Will get to them next.
Thanks, @staas!
[quote]@auburn: one more participant clicking Se-8 would cause the new calculator to output SeFi, rather than a tie. Looking forward to your thoughts though.[/quote]
As I discuss in the post you missed (according to your edit), I didn't check locked-on eyes because I thought looking at the camera wouldn't count as "point in the environment".
[quote]@auburn: Fayest, haven’t forgotten your questions! Will get to them next.[/quote]
And don't forget my three signal definition questions 😉
Alright so I have run chi-square statistics on the signals to determine which signals were the most different between the people who accurately predicted SeFi and the others.
The significant discrepancies (p-value under 0.05) were, in order from most significant to less :
All the next ones have the same p-value of around 0.05, which is significant
We can see most of the big confusion reside on the Pi functions, with people confusing Si and Ni, hence why the biggest errors were TeSi and SiTe typings
Now we have a big jump in p-value, from around 0.05 to around 0.08, so all the signals before are significant, and the next ones somewhat significant to explain the discrepancies
What we can see here is that the biggest source of confusion was the Pi function, with people incorrectly identifying Si when Ni was present, so maybe more precision of the corresponding signals is needed. Another source of confusion was the Ne vs Se function.
This shows there are relatively few mistakes on the energetics, but that Ne/Si vs Se/Ni the big source on confusion while the Judgement axis was clearly identified
I am not sure I can derive a good way to make a consensus from checked signals from such a small dataset, @auburn I would need as much typing reports as possible (anonymised if need be, i just want the type). there are ways to do so and I could probably tune your profiler empirically if you can provide me with a sufficiently large dataset (please in an excel, txt or csv form, you should add a function like that to the profiler, it's the easiest to use when running programs and it should not be too complicated)
Ok after discussing with a friend I ran a F-test which is supposedly more accurate in our small sample size case, here are the results and their P-values, remember the smaller the more explanative difference between people who predicted the correct type and the others. I represent only important P-values, under 0.05.
Ni3 : 0.000062
Se1 : 0.000078
Se3 : 0.004579
Se2 : 0.004579
Fi2 : 0.012658
Se9 : 0.012658
Si1 : 0.022442
Pi3 : 0.022442
Ne5 : 0.022442
Si3 : 0.022442
Se4 : 0.030622
P1 : 0.037521
Fi8 : 0.037521
Ne1 : 0.037521
Se10 : 0.042608
Te7 : 0.042608
Again the biggest confusion is clearly on the P signals, so there needs to be more clarification on P-axis identification
.
.
.